
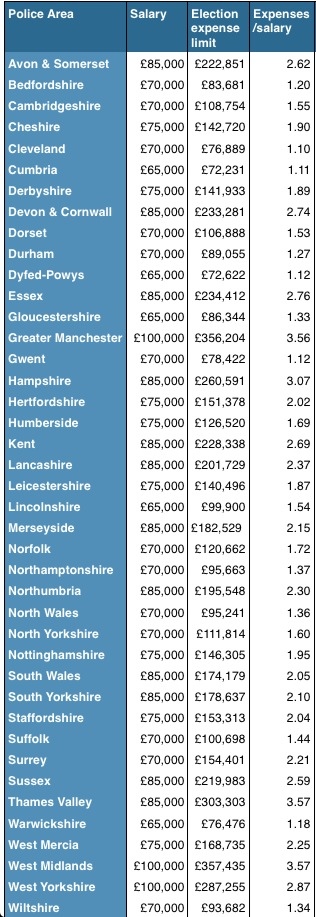
Below are the agreed salaries for the new Police and Crime Commissioners. They have been set by a complex process which allows for, among other things, those areas with larger populations to offer larger remuneration.
And below you will also find the limit for election expenses for each candidate in each police area for the period immediately preceeding the election. This is mostly related to the number of electors in each area.
So, perhaps there is an economist living inside me somewhere, as I thought it would be interesting to divide the maximum election expenses by the salary on offer in each area. And I note that the result generated varies considerably, from election expense limits that are 1.1 times salary in Cleveland all the way up to 3.7 times salary in Thames Valley and the West Midlands.
I don’t know what it proves though – so thought I would leave that part up to you. Clearly the salary probably ranks fairly low in most candidates’ reasons for doing the job and I would not be surprised if most candidates spent nowhere near their election expenses limit, but it seems odd that the ratios would be so different.
I’m particularly interested in whether independents find the ratio for their area encouraging or depressing. I suppose it may establish that no-one in their right minds would do this for the money. As a point of comparison, my recollection of parliamentary elections is that they would generate numbers that are roughly 0.2 to 0.25 – radically different to the situation with PCCs. If we accept that election expenses limits are there to level out the playing field among candidates, this suggests to me that the size of electorates at this election allows a significantly less-even playing field among candidates from a purely financial perspective.

Hi Sam
It is not so much depression as bemusement. I was challenged this morning to consider trying to raise some funds for my campaign. At present I have not quite achieved £4k towards the deposit. I would love a second house (particularly in the South of France) but I wouldn’t spend the value of my house on a campaign, even if I was presented with the sum from a generous donor.
Thames Valley has a population of 2.2m. Let’s assume that is 1m households. To just cover 2nd class postage (not leaflet printing costs) to those would be £500,000. Hmmm
Coming up with something interesting to say about Sam’s ratios is quite a challenge! OK, how about applying a bit of probability theory to the problem. Let’s assume that most independents will have some kind of private source of income to pay the bills while out campaigning, and that they would be taxed at the higher rate on 100% of their PCC salary. Everybody with me so far? Actually let’s not bother. The answer’s 1.96. QED